


This Jet Fuel Price Monitor provides the latest price data from the leading energy information provider Platts. The Jet Fuel Price Index and price data show the average prices paid at the refinery for aviation jet fuel for the reported week.
Please note that we are unable to provide historical price data; for additional fuel price information visit the Platts jet fuel microsite.
For any questions relating to this analysis, please contact the IATA Fuel Team: fuelteam@iata.org
Fuel Price Analysis
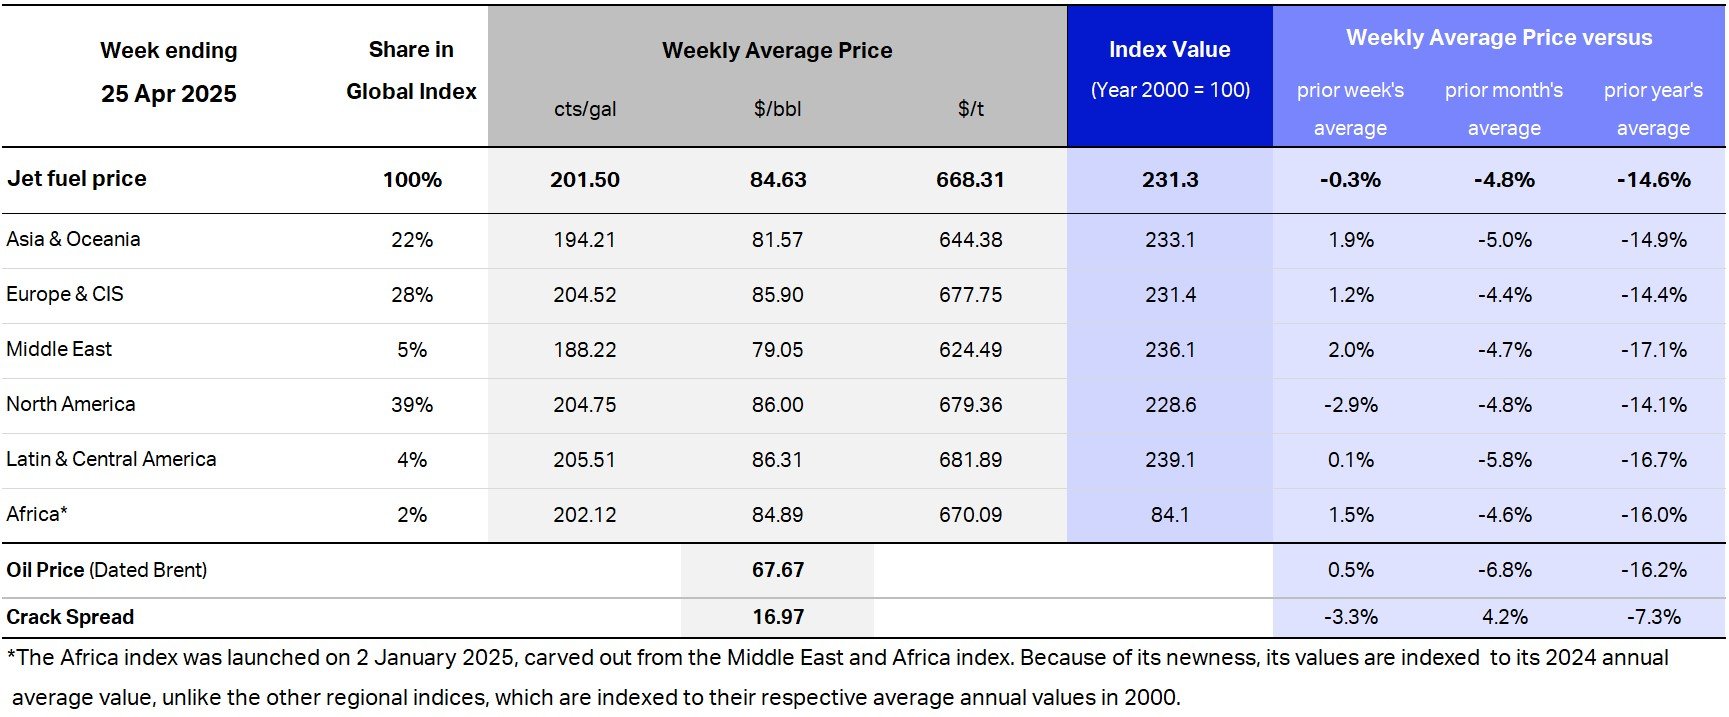
The global average jet fuel price last week fell significantly by 7.2% compared to the week before to $121.62/bbl.
Market highlights of the week
Oil Market
- Oil prices plummeted after the US Energy Information Administration reported a huge rise in gasoline stocks, a proxy for demand. Weak US jobs data for September and surging bond yields spark fear of an economic slowdown that would affect oil demand.
Jet Fuel Market
- The jet fuel average prices in all regions fell by a larger percentage than the fall in oil prices.
- European jet fuel prices was further pulled down by a collapse in diesel futures as the market betted on Russia lifting its ban on diesel exports. Demand for jet fuel continued to wane after the summer season even as imports continued to flow amply from East of Suez.
- Stock build in the US Gulf Coast contributed to the lower jet fuel prices in the US.
Recent Jet fuel price development
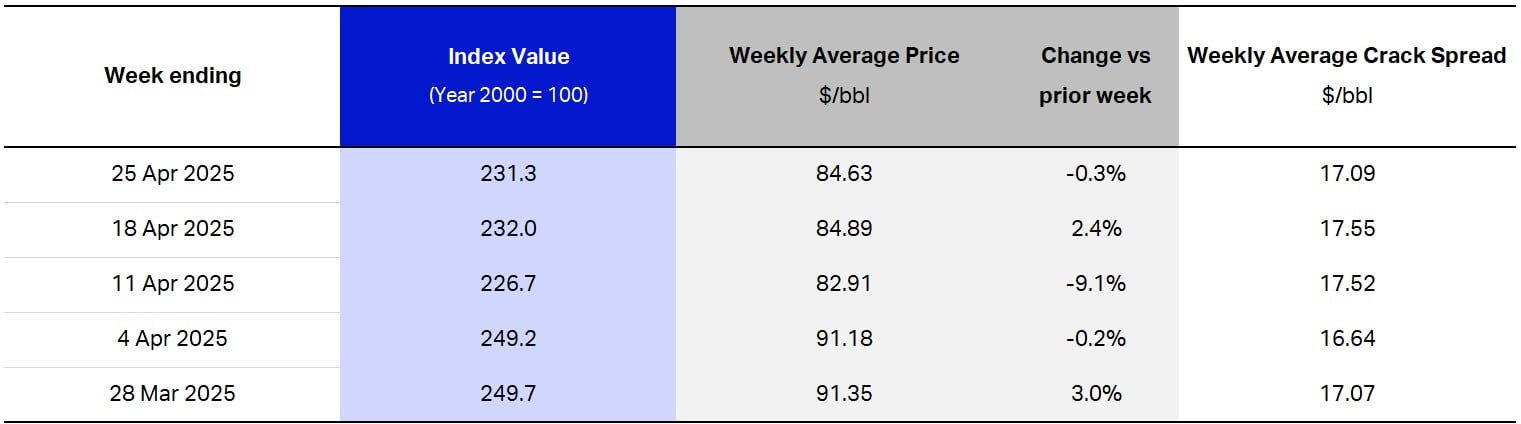
Taking a look at the price action over the past 24 months
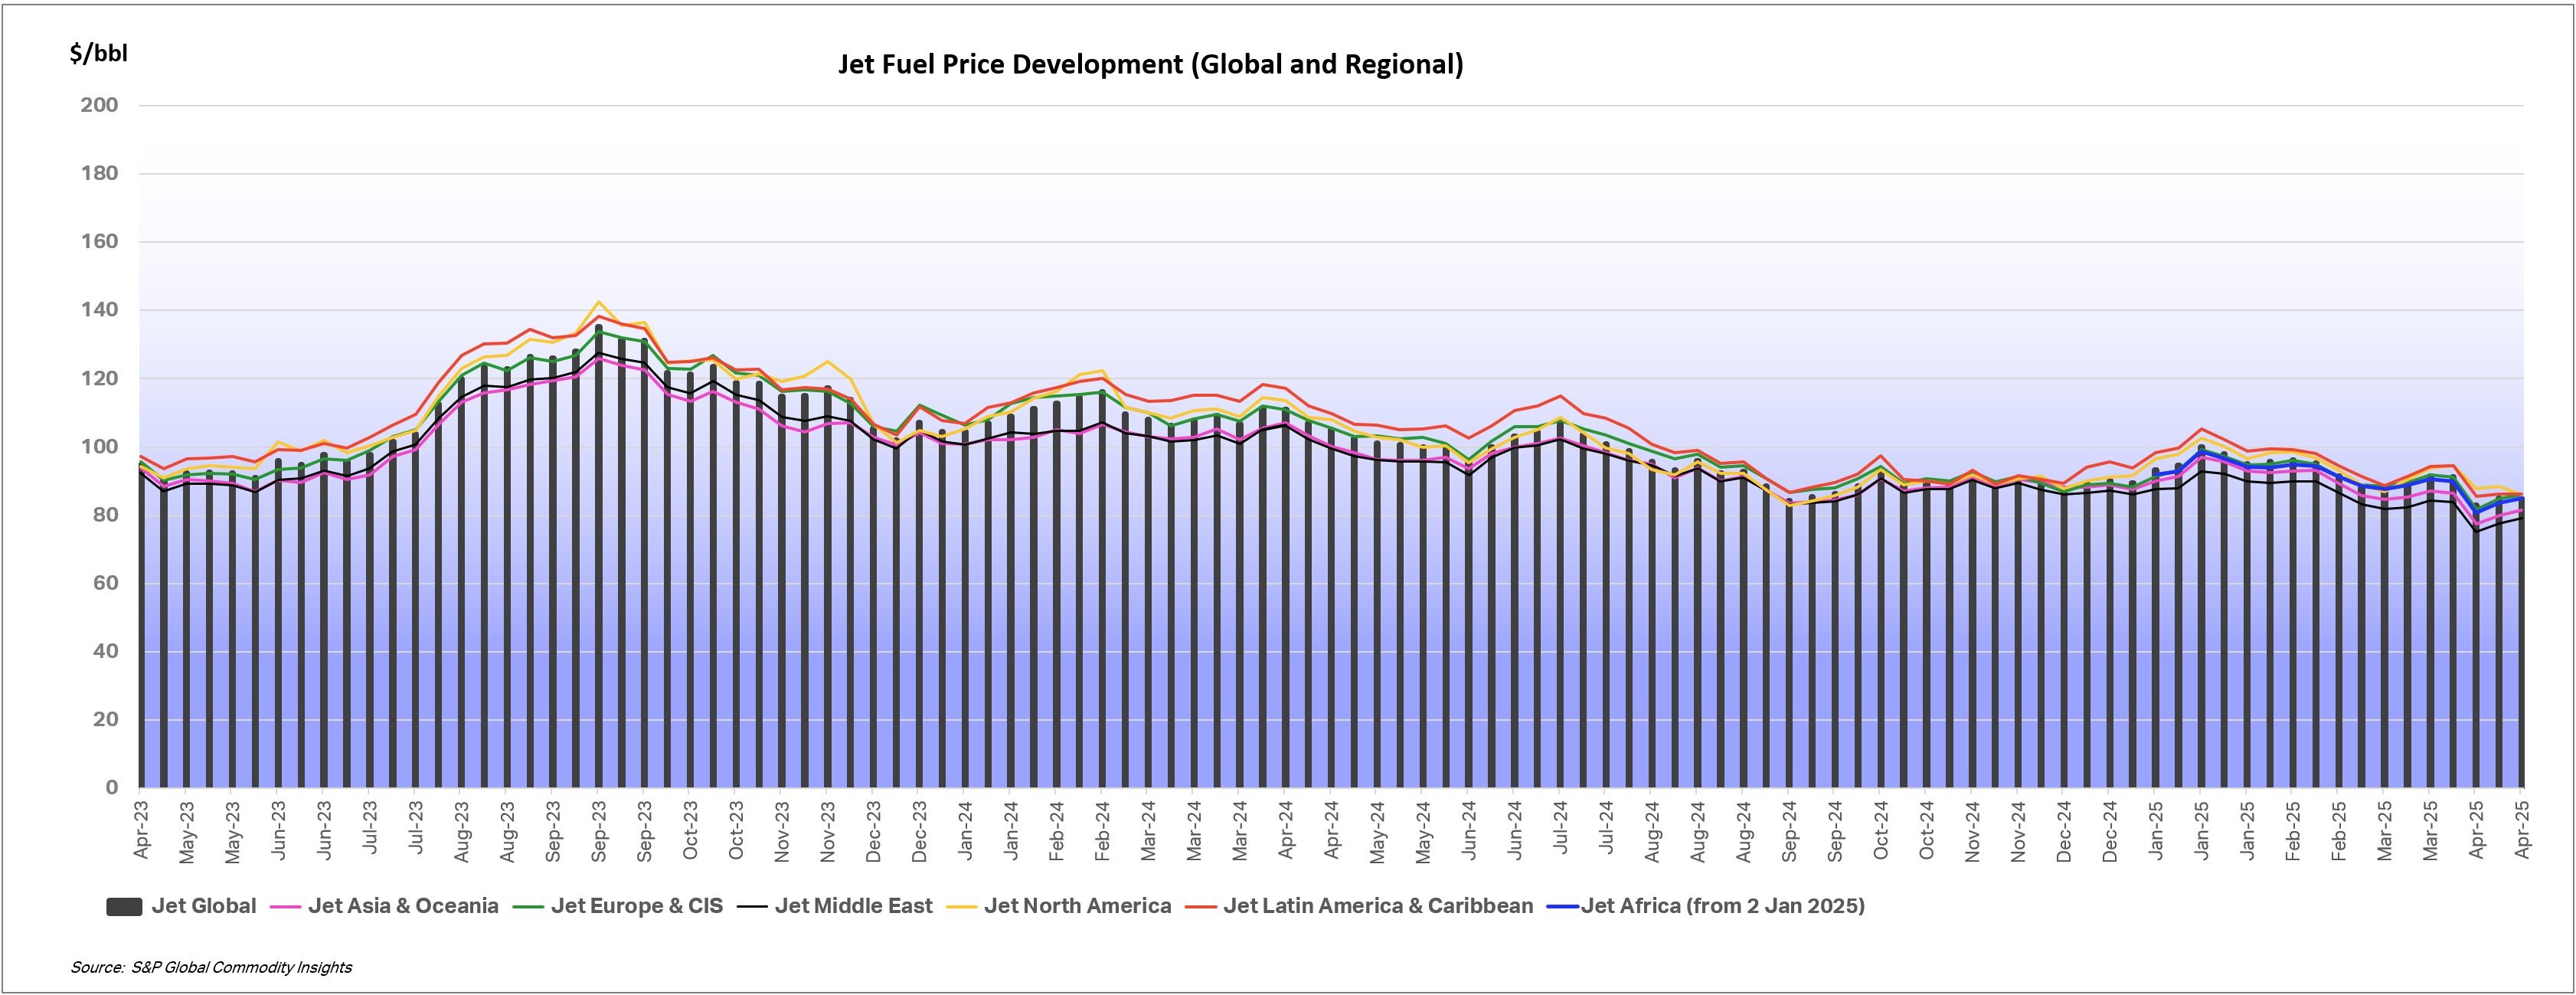
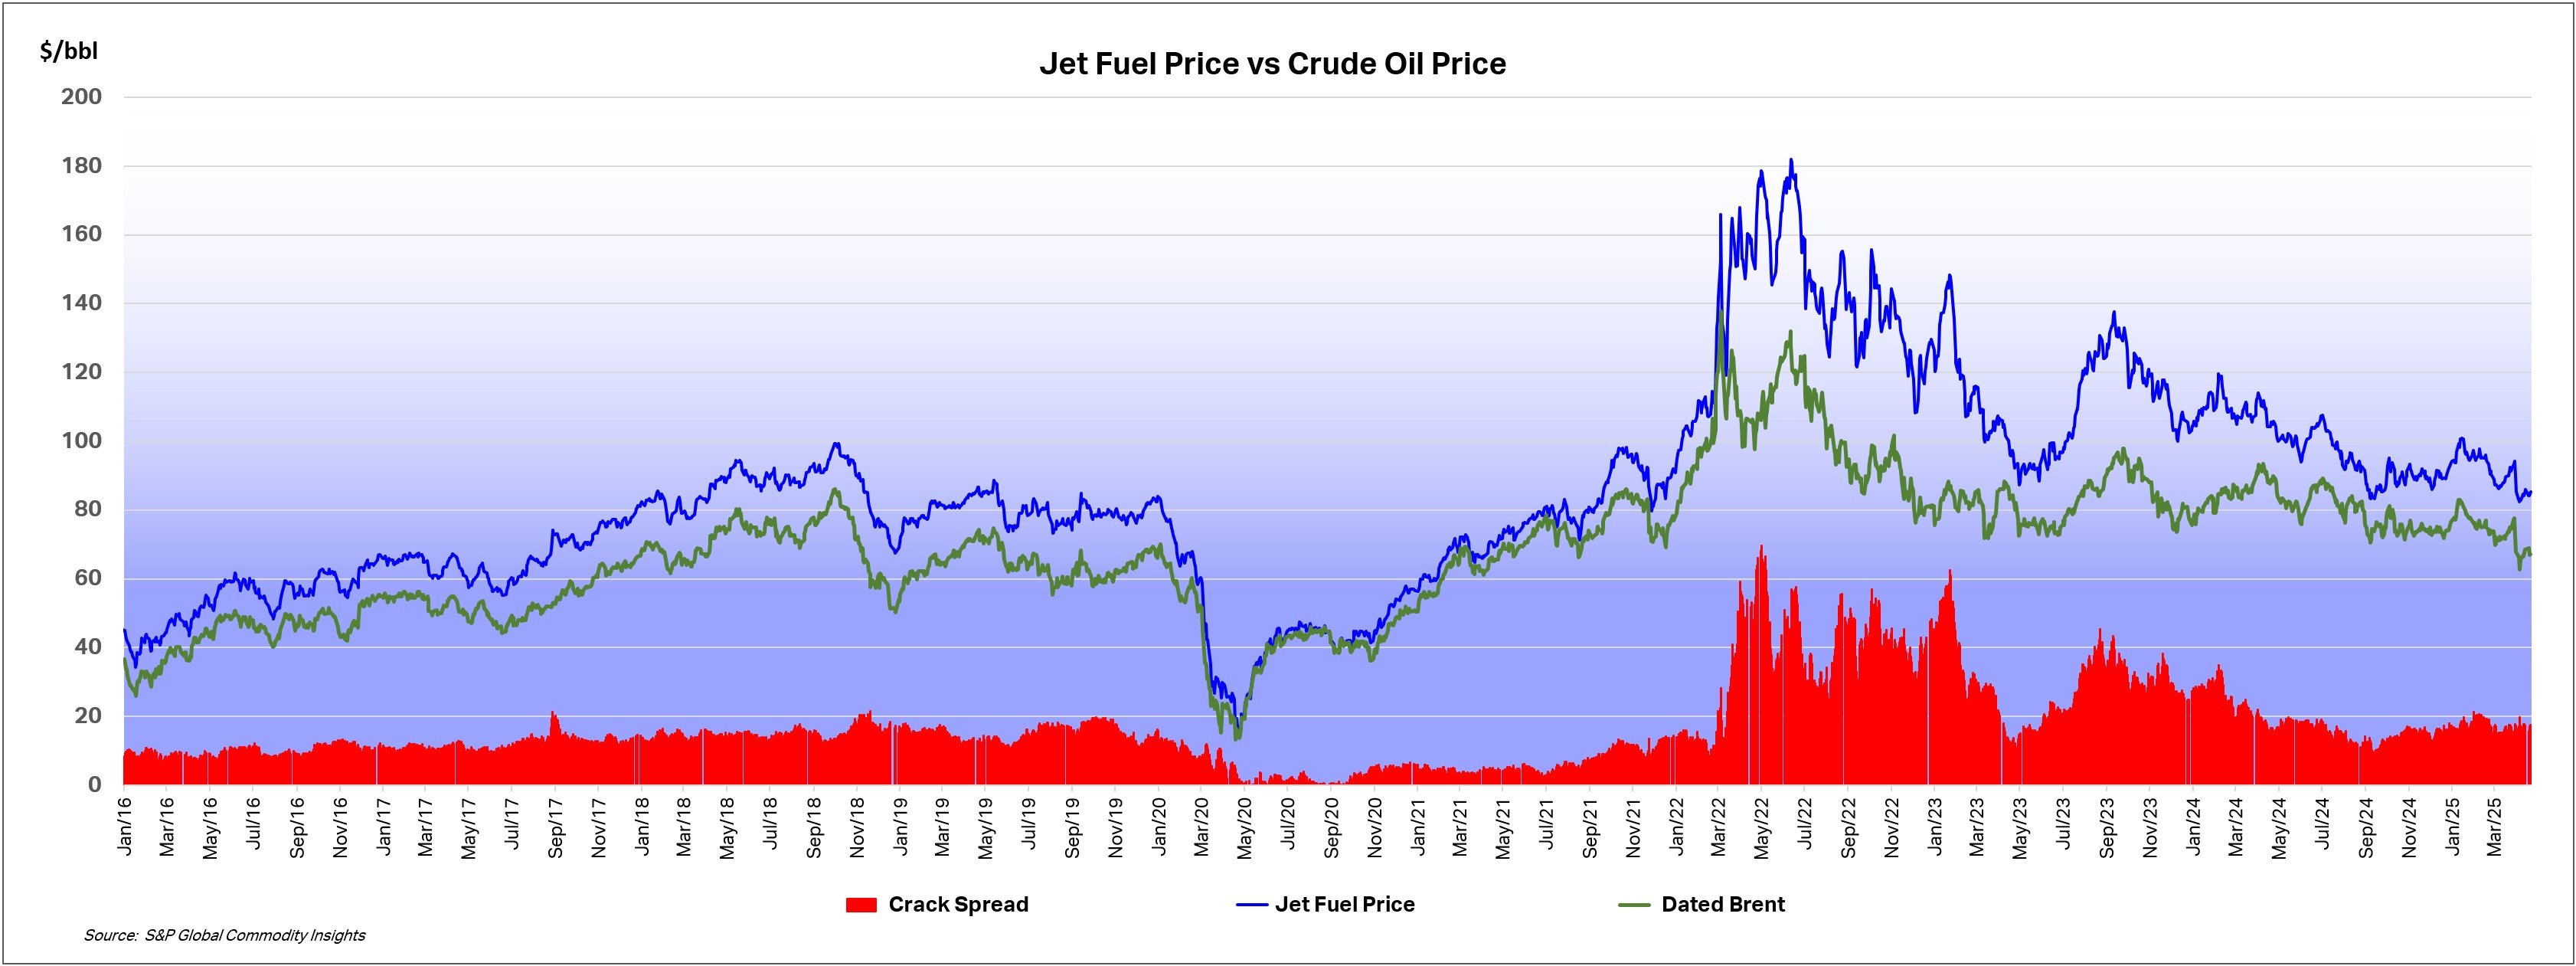
Jet fuel price developments - longer term perspective
Methodology for Platts Jet Fuel price index
Platts Jet Fuel Price Index is published by S&P Global Platts, reflecting its daily assessments of jet fuel spot prices in the physical spot market of relevant regional centers. When a market is not assessed on a particular day, for instance because of a market holiday, the previous working day's spot market price assessment is used.
Each of the individual Platts' assessments is given a weighting by Platts in the regional baskets, based primarily on demand for jet fuel in the region; in a similar way, each of the regional indices is given a weighting in the Global Composite Index .
These values are compared with the average spot prices in 2000, similarly weighted by demand during that period, to generate a percentage figure reflecting the overall rise in markets compared to the base period. As an example, an index value of 200 reflects a doubling of price since the year 2000.
The full detail of the methodology can be found on the S&P Global Platts website.
Please note that all aspects of the Jet Fuel Price Index methodology and data, including the underlying data, are the intellectual property of S&P Global Platts, a division of S&P Global Commodity Insights.